Session 07: Designing The Chart
Hello and welcome to this session of the Vision Chart project where I am generating a chart that measures Cryptiquest’s progress toward its vision. In the last session, I identified the capability packages that are needed to bridge progress from the moment when all the objectives become activated to the point the vision is realized. In this session, I am going to design the vision chart.
The capability list (seen below) plots a pathway for unlocking necessary components for measuring objectives and the capabilities required to successfully meeting those objectives.
- Project Management Package
- Guide Extension
- Guide Creation
- Tool Extension
- Feedback Extension
- Tool Creation
- Concept-to-Publish Suite
- Game Engine
- Media Extension
- Media Creation
- Pubic Outreach Extension
- Event Attendance
- Digital Extension
- Community Bridge
- Global Outreach
- Humanistic Reputation
- Tool Upgrade Faculty
- Engine Upgrade Faculty
- Translation Faculty
- Under-privileged Outreach Faculty
- Regional Barrier Researchers Faculty
- Disenfranchisement Researchers Faculty
- Quality Assurance Faculty
- Sales Faculty
- Audit Faculty
- Union
- Knowledge Development Program
- Partner Reputation Metrics
- SEO Faculty
- Event Faculty
I think the Vision Chart should have the capability packages presented in a way that describes the nature of the company. Something like the following:
- A. Guide Phase
- Project Management Package
- Guide Extension
- Guide Creation [CQ Project Management]
- B. Tool Phase
- Tool Extension
- Feedback Extension
- Tool Creation
- Concept-to-Publish Suite
- Game Engine [CQ StoryHammer]
- C. Media Phase
- Media Extension
- Media Creation (Imbue and Copperwealth)
- D. Audience Building Phase
- Pubic Outreach Extension
- Event Attendance
- E. Digitization Phase
- Digital Extension
- Global Outreach Extension
- F. Business Expansion Phase
- Community Bridge
- Humanistic Business Restructuring
- Sales Faculty
- Event Faculty
- G. Product Upgrade Phase
- Tool Upgrade Faculty
- Engine Upgrade Faculty
- Quality Assurance Faculty
- H. Business Refinement Phase
- Audit Faculty
- Union
- Knowledge Development Program
- Partner Reputation Metrics
- SEO Faculty
- I. Global Reach Phase
- Translation Faculty
- Under-privileged Outreach Faculty
- Regional Barrier Researchers Faculty
- Disenfranchisement Researchers Faculty
I wonder if I should put the objectives in this chart – like when they are activated and have a capability to be realized and what they even are? I suppose it couldn’t hurt, except for how much space all this information will take. Writing out 30 capabilities and 32 objectives is a lot of information. Perhaps the objectives could be represented by numbers and the explanations could be listed somewhere else? Maybe they are activated upon pressing, like a tool tip for mobile…?
Also, the objectives are split into seven segments which should somehow be incorporated:
Process | Brands | Tools | Media | Presence | Reputation | Reach
Should each capability package be explained? How in the world will all of this be displayed on a webpage? Especially for mobile devices? Designing for mobile-first, I suppose the scrolling feature is the most important thing and scrolling should represent the journey to the vision, yes?
So I have capability packages, package explanations, phases, objectives, objective activations, and objective realization potentials – and all of those are to be represented on mobile.
Well then, starting at the top, there should be an explanation of the vision, then a tour of the phases from Exploration to Vision. Perhaps vertical bands in the background can represent the segments and the capabilities can be in boxes that can be clicked, which would light the correlating band behind it. Numbers with pop-up information could represent objective activation. Not sure what to do about objective completion possibility – it seems to be the lowest priority.
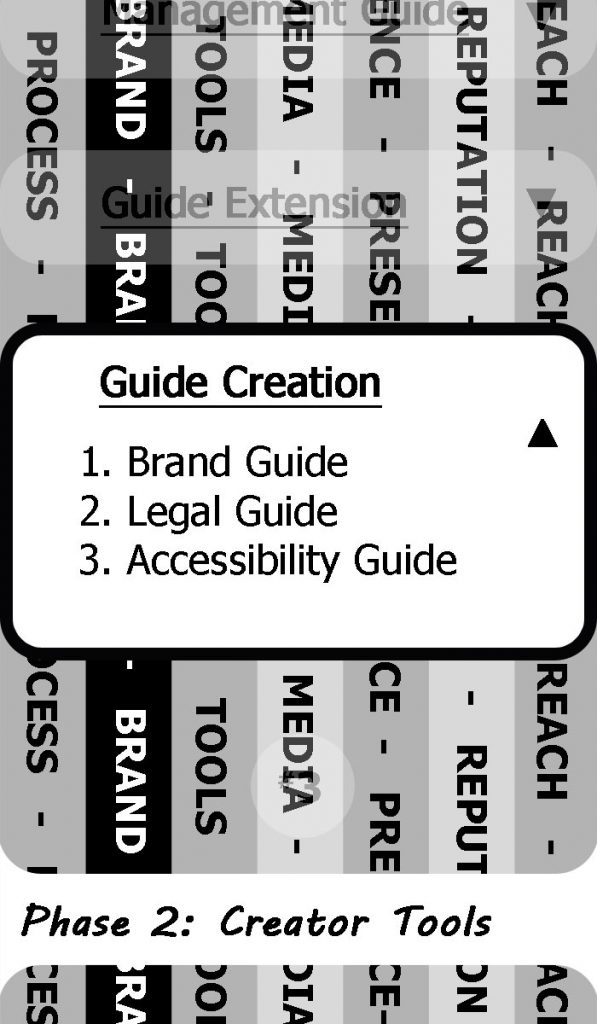
Here is a test image of what something fitting this description might look like on mobile. (Note that I like to create things in black and white first to nail down contrast before adding color.) I hate the way this looks.
Maybe, instead of doing this complicated infographic thing, it should just be an outline? Perhaps with accordion functionality?
Meh. What I’d like to create is something a little more “flowy” – maybe like a map you can zoom in on with icons you can click.
Not sure how to do all of that. Maybe that’s a future development. For now, I could place each phase into an accordion panel. Then each of those could have an accordion for each capability package and objective?
Something like:
Company Phases
- Project Management Package
- Guide Extension
- Guide Creation [CQ Project Management]
- Tool Extension
- Feedback Extension
- Tool Creation
- Concept-to-Publish Suite
- Game Engine [CQ StoryHammer]
- Media Extension
- Media Creation (Imbue and Copperwealth)
- Pubic Outreach Extension
- Event Attendance
The problem with this is that the interior panels are somewhat limited. Though, they are HTML enabled so I could do whatever I want, I suppose. I also think that all of these “extensions” I’ve included – while they make sense to me – won’t make sense to readers.
Maybe the vision chart will focus on specific milestones and not every single milestone. Something like:
- Brand Building Phase
- CQ Project Management Guides
- CQ Crafting Tools and Game Engine (Storyhammer)
- CQ Media (Imbue & Copperwealth)
- Audience Building Phase
- Local Shops and Events
- Digitization Phase
- Regional/National Events
- Business Building Phase
- Business Restructure
- Sales and Staffing
- Product Refinement
- Global Creativity Building Phase
- Demographic Research
- Translations and Regional Outreach
- Disenfranchised Outreach and Non-profit
This feels really watered down but I think it’s easier for people to understand than the original 30 milestones. Also, am I really to expect that I can wait until Phase 2 before going into shops and events? I need to test these tools with people other than my friends and I’ll eventually need to meet with people to do so. I suppose that will still happen but phase 2 is when it’s really concentrated on – like tour stuff.
What about the objectives? Should I list those out? Should they be made public? I can’t remember what is or isn’t important anymore. Ah. I’ll go back to the kick-off session and remind myself of what’s at stake here.
Here are the goal and objectives for the Vision Chart:
Goal: To create a chart of Cryptiquest’s progress toward the ideal state.
- The chart shows current capabilities regarding the 9 attributes.
- The chart shows the ideal capabilities of the 9 attributes.
- The chart will be placed under the About page on the company site.
The objectives are pertinent to project management standards but not necessarily to the Vision Chart. The capabilities are important for knowing when and how to measure the objectives but not really for the Vision Chart. The Vision Chart was just an excuse to show this work publicly. So I think the “watered down” version does an okay version of that.
I think the company objectives do need to be somewhere in an official capacity. Perhaps I can list those in a separate About page simply called “Our Objectives.” And that can just be a text over view of segments and objectives.
The Vision Chart can then be an icon-fueled timeline toward the vision and what about the capabilities? Should I put those somewhere? I don’t think I should in an official capacity as they aren’t well researched. I think they served their purpose and now as the company progresses, real research will happen as needed.
So, in the next session, I will produce the Vision Chart and the Objectives page. So long for now.
Action Items
- None